Biyernes, Enero 23, 2015

Third Qua Na Mhen...

Yessss.... Third Qua na :))

Ang tanging goal ko lang ngayong qua ay...

I-FLAT 1 ang Comp.Sci.

Dear Sir Tom,
       Sana po tulungan mo akong maka-flat 1 sa comp. sci. ngayon third quarter. Please po. Kahit one time lang po gusto ko mag-DL. Bagsak na nga po ako sa math at pehm. PLEASE.

Truly Yours,
Joellee :))

Spreadshet For Data Analysis


Introduction...
  • Worksheet is the page you work on which is made up of grid cells.
  • Cell/Selected Cell is where you type data/formula into.


Column/Row Heading: Use the column/row headings to identify a cells position on the worksheet i.e. A12, B6. Click heading buttons to select a whole column/row of cells.

Name Box: Holds a cell’s selected reference number – it’s position on the worksheet


-is a standardized representation for a particular kind of data

CURRENCY : -922,337,203,685,477.5808 to 922,337,203,685,477.5807 with four decimal digits of fixed precision.
DATETIME: Valid dates are all dates after January 1, 1900.
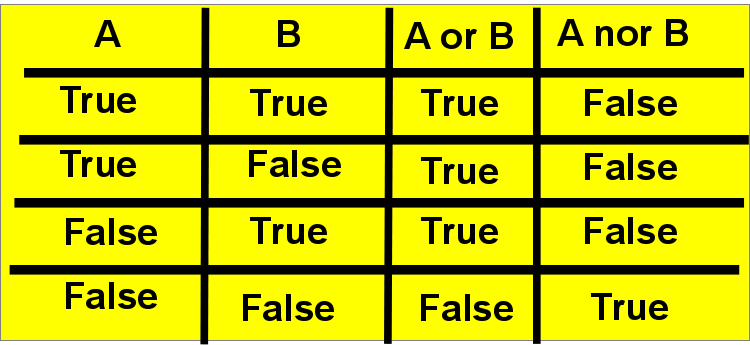
• LOGICAL/Boolean – true or false
• NUMBER
                    – Whole Number from (-2^63) to (2^63-1)
                    – Decimal Number -1.79E +308 through -2.23E - 308,                        0, 2.23E -308 through 1.79E + 308
• TEXT 268,435,456 Unicode characters 
Source: moodle.pshs.brc.edu.ph 

Formula

Formula
– an expression used to perform calculations
– begin with an equal ( = ) sign
– Composed of operands and operators
– May contain constants, cell references, ranges, and grouping symbols

Operators Used in Formula
          *Operators specify the kind of calculation that you want to perform on the elements of a formula. Excel performs calculations in a standard order, but you can also control the order of calculations.


Operator Precedence in Excel Formula
     *If you combine several operators in a single formula, Excel performs the operations in the order shown in the following table. If a formula contains operators with the same precedence — for example, if a formula contains both a multiplication and division operator — Excel evaluates the operators from left to right.


Sources:  moodle.pshs-brc.edu.ph
                office.microsoft.com
                spreadsheets.abou.com

Functions

Functions

– A predefined formula 
– May require arguments as inputs 
– Returns a value 
– May be used together with other functions  and other operations 

Examples:
=PRODUCT(150,.05) 
=SUM(A1,A2) 
=AVERAGE(B1:B10) 
=COUNTA(A1:A100) 
=NOW() 
=MAX(Z2:Z5) 

=MIN(Z4:Z8)

ERRORS
• #DIV/0! 
• #N/A – missing data/found no match 
• #NAME? - undefined range or cell name 
• #NULL! - two ranges that don’t actually intersect 
• #NUM! - pass an invalid argument to a function 
• #REF! - invalid cell reference 
• #VALUE! - argument for a function is of an incorrect data type


Sources:
http://office.microsoft.com
http://spreadsheets.about.com
http://moodle.pshs-brc.edu.ph/

Cell Reference

A string identifying a particular cell in a spreadsheet, possibly relative to the cell containing the reference. A cell reference may be absolute (denoted by a "$" prefix in Excel ) or relative (no prefix) in each dimension, thus, e.g. B$6 refers to the second cell across in the sixth row.

Single Cell- A1
Cell B1 and B2- B1,B2
Range from C1 to C5- C1:C5
Range from A1 to L1- A1:L1

Reference Types 
• Relative - automatically changes when the  formula is copied down a column or across a row 
• Absolute - cell reference is fixed, doesn’t  change when copied to other cells. 
• Uses $ sign like: $A$1 
• Mixed - has either an absolute column and  a relative row, or an absolute row and a relative column 

• Like A$1 or $A1

Referencing other the Sheet
• Same file 
         – Manual selection 
         – Use a formula 
         • Ex: Sheet2!A1 
• Different file 
          – Manual selection 
          – Use a formula 
        • Ex: [File2.xlsx]Sheet1!$A$1 

          •Absolute by default


Sources:
http://office.microsoft.com
http://moodle.pshs-brc.edu.ph

Logical Operation and Function


  1. The concept of logical operators is simple. They allow a program to make a decision based on multiple conditions. Each operand is considered a condition that can be evaluated to a true or false value. Then the value of the conditions is used to determine the overall value of the op1 operator op2 or !op1 grouping.

  2. Functions 
    =AND( logical1, logical2, … ) 
    =OR( logical1, logical2, … ) 
    =NOT( logical)
Source:
http://moodle.pshs-brc.edu.ph/

IF

IF Function 
returns one value if a condition you specify evaluates to TRUE, and another value if that condition evaluates to FALSE

=IF(logical_test, [value_if_true], [value_if_false])


Example of Single Range
=IF(AND(A1>0,A1<11),“Valid",“Invalid") 

Example of Exact Value
=IF(A1=1,“One", IF(A1=0,“Zero",”Invalid”)) 

Example of Ranges
=IF(AND(A1>0,A1<11),“One to Ten", IF(AND(A1>11,A1<21), “Eleven to Twenty",“Invalid"))


Sources:
http://moodle.pshs-brc.edu.ph/

Huwebes, Enero 22, 2015

Conditional Formatting

  1. Conditional formatting is a feature of Excel which allows you to apply a format to a cell or a range of cells based on certain criteria. For example the following rules are used to highlight cells in the conditional_format.py example: worksheet.
  • Highlight Rules 
  • Top/Bottom Rules 
  • Data Bars 
  • Color Scales 
  • Icon Sets Add your new rule!


Adding New Rule 
 - add a formula that contains a
condition and add new formatting. 
Ex: =A1=“True”


Sources:
http://moodle.pshs-brc.edu.ph/
office.microsoft.com

Data Representation


  1. Data Representation refers to the methods used internally to represent information stored in a computer. Computers store lots of different types of information: numbers. text.


Column charts
 - useful for showing data changes over a period of time or for illustrating comparisons among items.


Line charts
 - display continuous data over time, set against a common scale, and are therefore ideal for showing trends in data at equal intervals.


Pie charts
 - show the size of items in one data series, proportional to the sum of the items. The data points in a pie chart are displayed as a percentage of the whole pie.


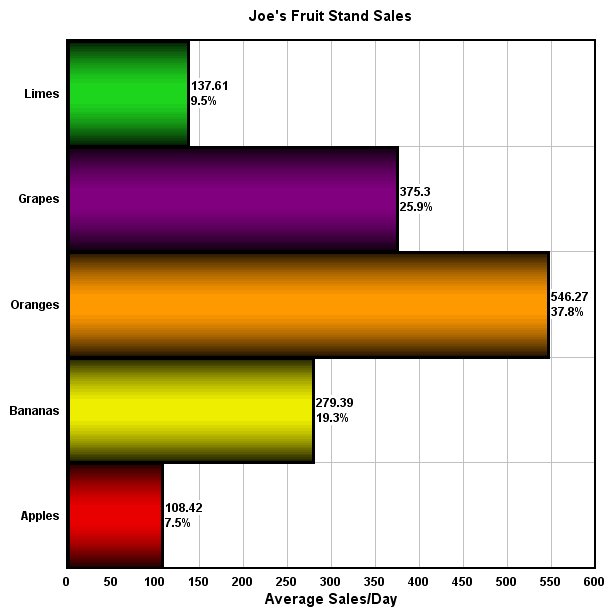
 Bar charts
 - illustrate comparisons among individual items.
When to use:
     • The axis labels are long.
     • The values that are shown are durations.


Area charts 
 - emphasize the magnitude of change over time, and can be used to draw attention to the total value across a trend.


Sources:
http://moodle.pshs-brc.edu.ph/
office.microsoft.com 


Macros

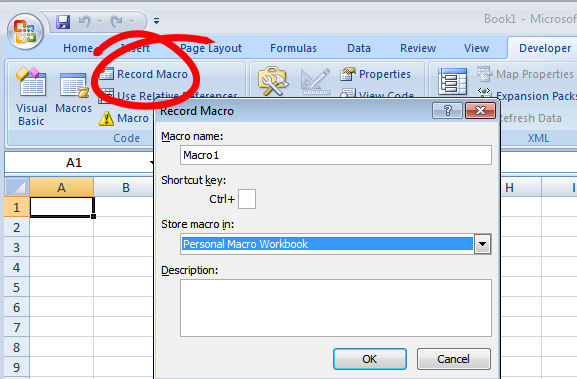
  1. A macro is a series of written instructions or recorded keystrokes and mouse actions. With a single keystroke, play back these activities at a much faster speed than can be performed manually. Eliminate wasted time and the risk of error that typically occur when performing repetitive tasks.


  1. Macros are used to make a sequence of computing instructions available to the programmer as a single program statement, making the programming task less tedious and less error-prone.


Sources:
http://en.wikipedia.org/wiki/Macro_%28computer_science%29